📖 Overview
This capstone project leverages historical NCAA tournament data to predict Purdue’s performance in March Madness 2024. Our approach combines rigorous data preprocessing, dimensionality reduction techniques, and multiple classification algorithms to generate actionable insights.
Key Question: How many games will Purdue win in the 2024 NCAA Tournament?
📂 Project Structure
marchmadness-prediction/
├── data/           # CSVs for training, validation, final predictions & raw misc
├── notebooks/      # Jupyter notebooks with analysis & code
├── reports/        # Final PDF reports: evaluation & modeling
└── slides/         # Presentation decks
🔍 Dataset & Methodology
Our analysis uses a carefully structured dataset split:
- Training Set (
training_data.csv): Historical tournament data for model training - Validation Set (
val_data.csv): Used for hyperparameter tuning and model selection - Test Set (
final_predictions.csv): Hold-out predictions for final evaluation - Auxiliary Data (
misc_data/): Additional team statistics for feature engineering
We engineered features from team performance metrics, efficiency ratings, and historical tournament outcomes to create a comprehensive predictive framework.
📊 Exploratory Analysis: PCA Visualizations
To understand the underlying structure in our high-dimensional feature space, we applied Principal Component Analysis (PCA). These visualizations reveal how teams cluster based on their performance characteristics.
2D Principal Component Analysis
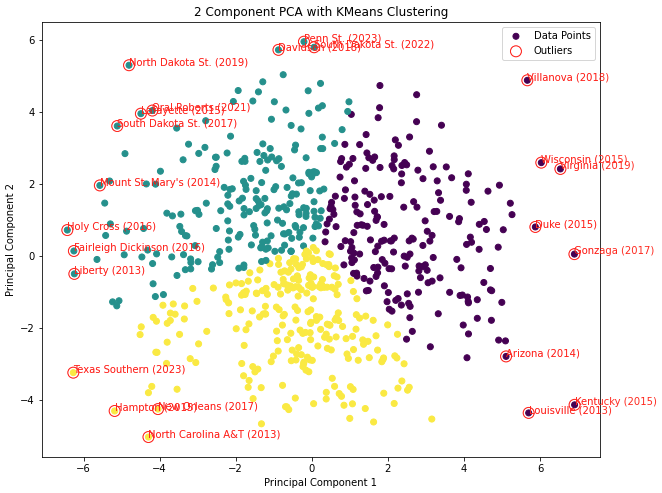
2D projection showing team clustering patterns in the feature space
3D Principal Component Analysis
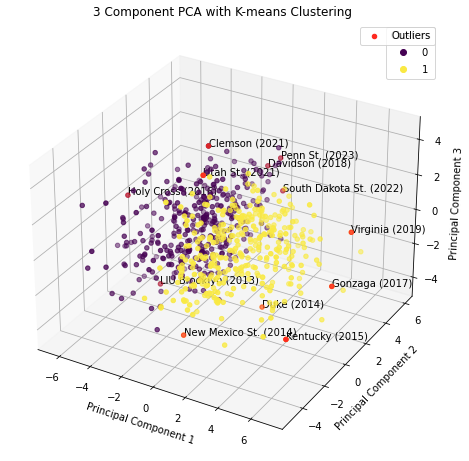
3D visualization revealing additional variance structure in team performance metrics
🌟 Feature Importance Analysis
Using Random Forest’s built-in feature importance scoring, we identified the most predictive variables for tournament success. This analysis helps validate our domain knowledge and guides future feature engineering efforts.
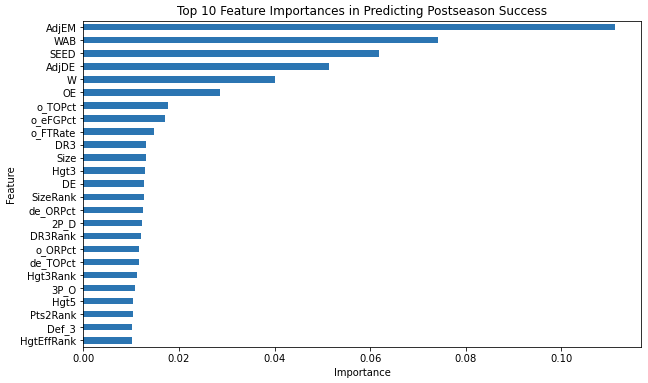
Top 10 most influential features according to Random Forest classifier
🏀 Model Predictions
Our final models generate win probabilities for each team in the tournament bracket. These probabilities reflect each team’s likelihood of advancing through successive rounds based on their historical performance patterns.
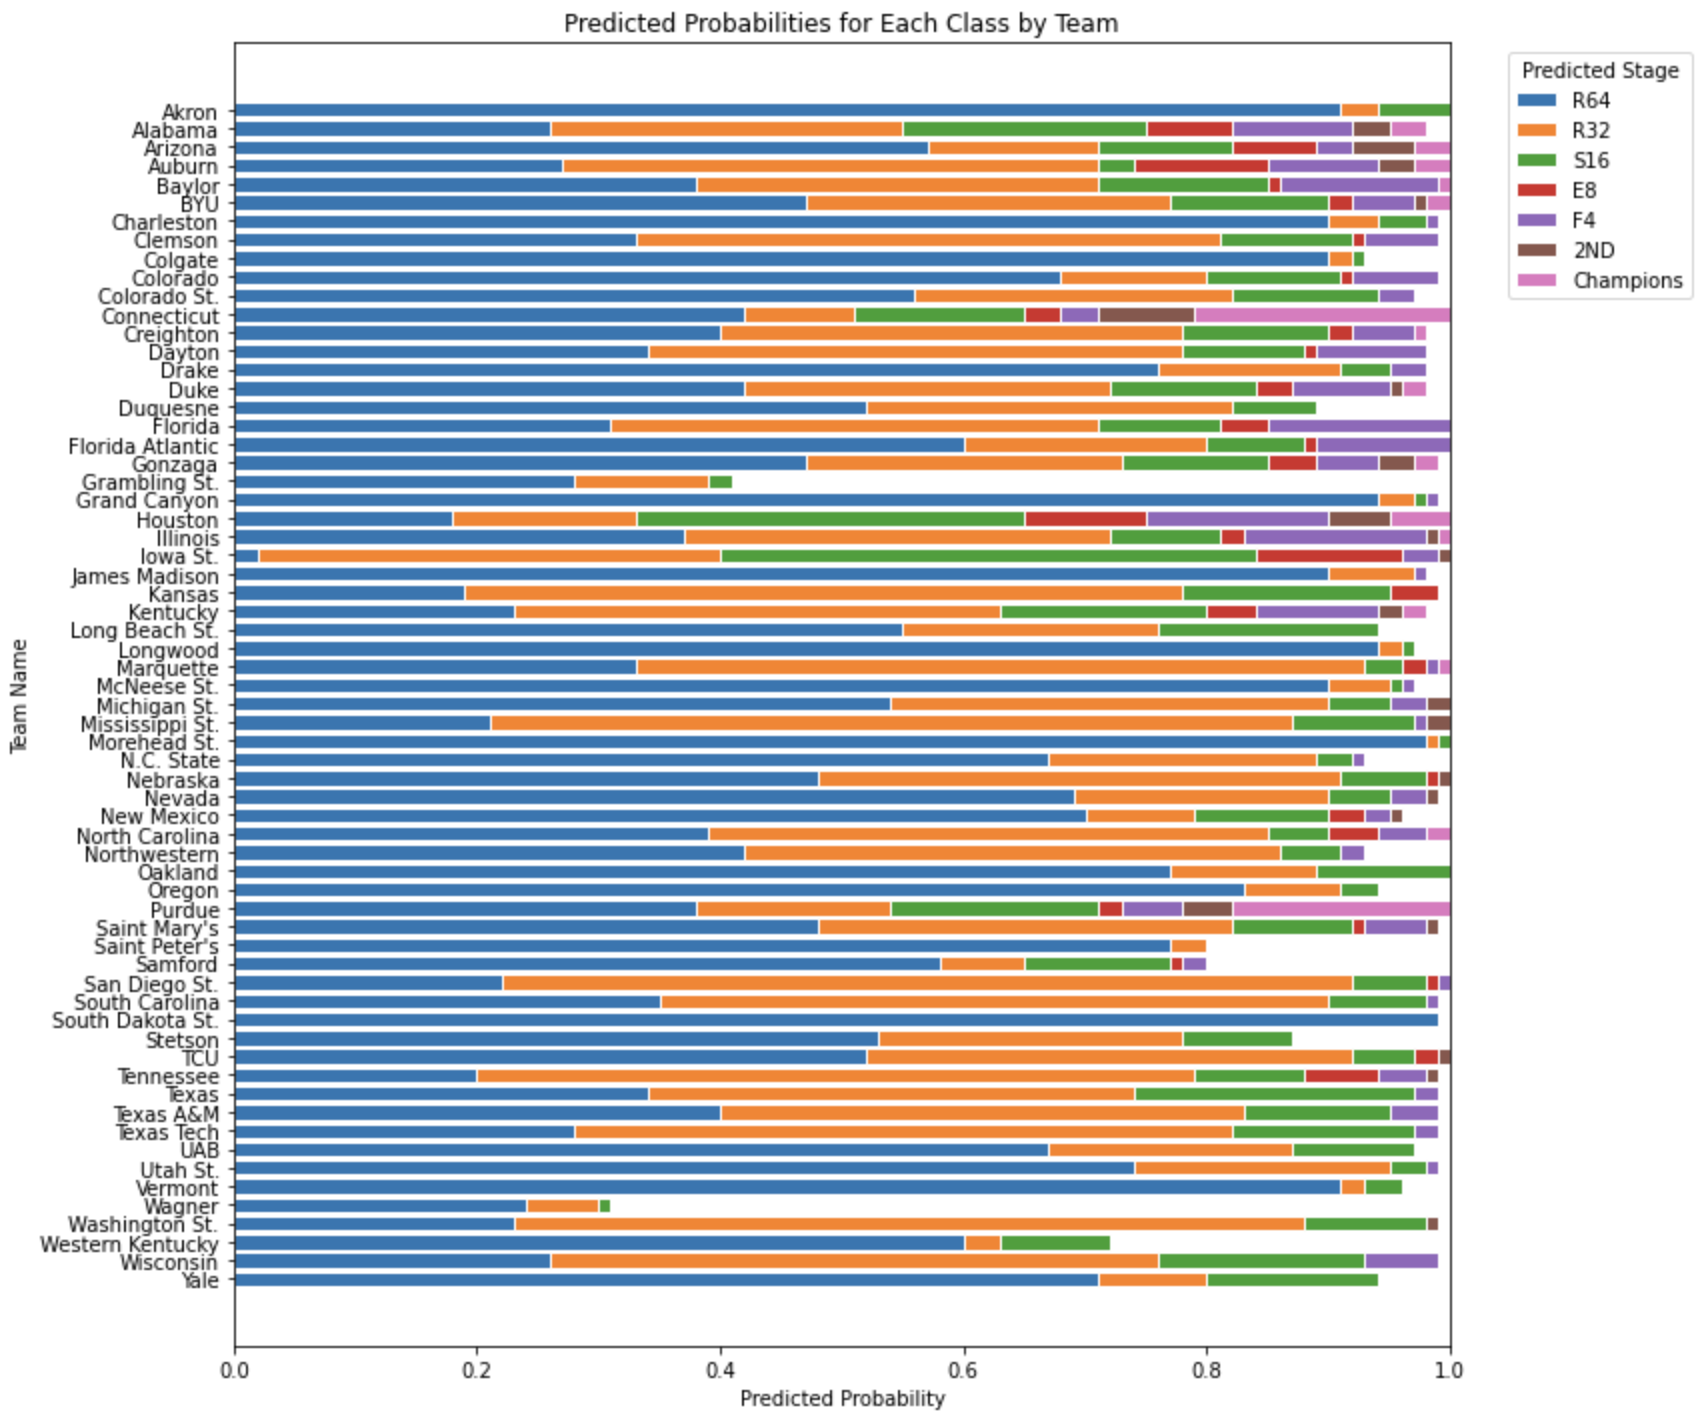
Tournament bracket with predicted win probabilities for all participating teams
📈 Model Performance Comparison
We evaluated four classification algorithms using both initial parameters and hyperparameter-tuned versions. Logistic Regression achieved the highest overall accuracy, while Random Forest uniquely predicted Purdue’s exact tournament outcome.
| Model | Initial Accuracy | Tuned Accuracy |
|---|---|---|
| Logistic Regression | 0.5641 | 0.6667 |
| SVM | 0.4615 | 0.5385 |
| KNN | 0.4300 | 0.4839 |
| Random Forest | 0.4146 | 0.4390 |
Weighted macro-average across accuracy, precision, recall, and F1-score
⚖️ Business Objective: Purdue Performance Prediction
Our primary business goal was to accurately predict Purdue’s tournament run. Here’s how each model performed against the actual outcome:
| Model | Predicted Round | Implied # Wins | Actual Round | Actual # Wins |
|---|---|---|---|---|
| Logistic Regression | Final Four (Semis) | 4 | Championship (Final) | 5 |
| SVM | Final Four (Semis) | 4 | Championship (Final) | 5 |
| KNN | Final Four (Semis) | 4 | Championship (Final) | 5 |
| Random Forest | Championship Runner-up | 5 | Championship (Final) | 5 |
Key Insights:
- Logistic Regression, SVM, and KNN predicted Purdue would reach the Final Four (4 wins)
- Random Forest correctly predicted Purdue’s championship game appearance (5 wins)
- All models met our “within 1-round error” business criterion
🎯 Key Takeaways
-
Business Success:
All models achieved our primary business objective of predicting Purdue’s performance within one round -
Metric Trade-offs:
Random Forest achieved perfect accuracy for our specific business case (Purdue’s run) despite having lower overall tournament accuracy (0.439), highlighting the importance of aligning model selection with business objectives -
Feature Insights:
Tournament seeding and efficiency metrics (AdjEM, AdjDE) emerged as the most predictive features across all models, validating established basketball analytics principles
🔮 Future Enhancements
- Ensemble Methods: Combine models using stacking or blending to leverage both high overall accuracy and business-specific precision
- Probability Calibration: Apply Platt scaling or isotonic regression to better align predicted probabilities with observed outcomes
- Sequential Modeling: Develop game-by-game prediction models that account for matchup-specific factors
- Real-time Integration: Incorporate live data feeds (injuries, momentum, betting lines) for dynamic probability updates throughout the tournament
🔗 Source Code
Explore the complete codebase, including data preprocessing, model training, and evaluation scripts: